One experiment.
Torn apart.
Every month.
The hypothesis, the spend, the pivot at week three when the funnel cracked, and the ugly spreadsheet that revealed the real lever. For solo founders, in-house marketers, and agency strategists who need frameworks they can use Monday morning.


2,400+ founders & marketers subscribed


"this is where we doubled down"

NOV 2025
the real lever:
CAC ÷ 3
Week 3 pivot

−47%
Blended CAC after creative rotation
Swapping static ads for 6-second native video on a $3,200 test budget revealed the single creative variable that was inflating spend by nearly half.
The hypothesis was about format. The real finding was about thumbnail contrast ratios and the 1.4-second scroll-stop threshold that separates a seen ad from an ignored one.
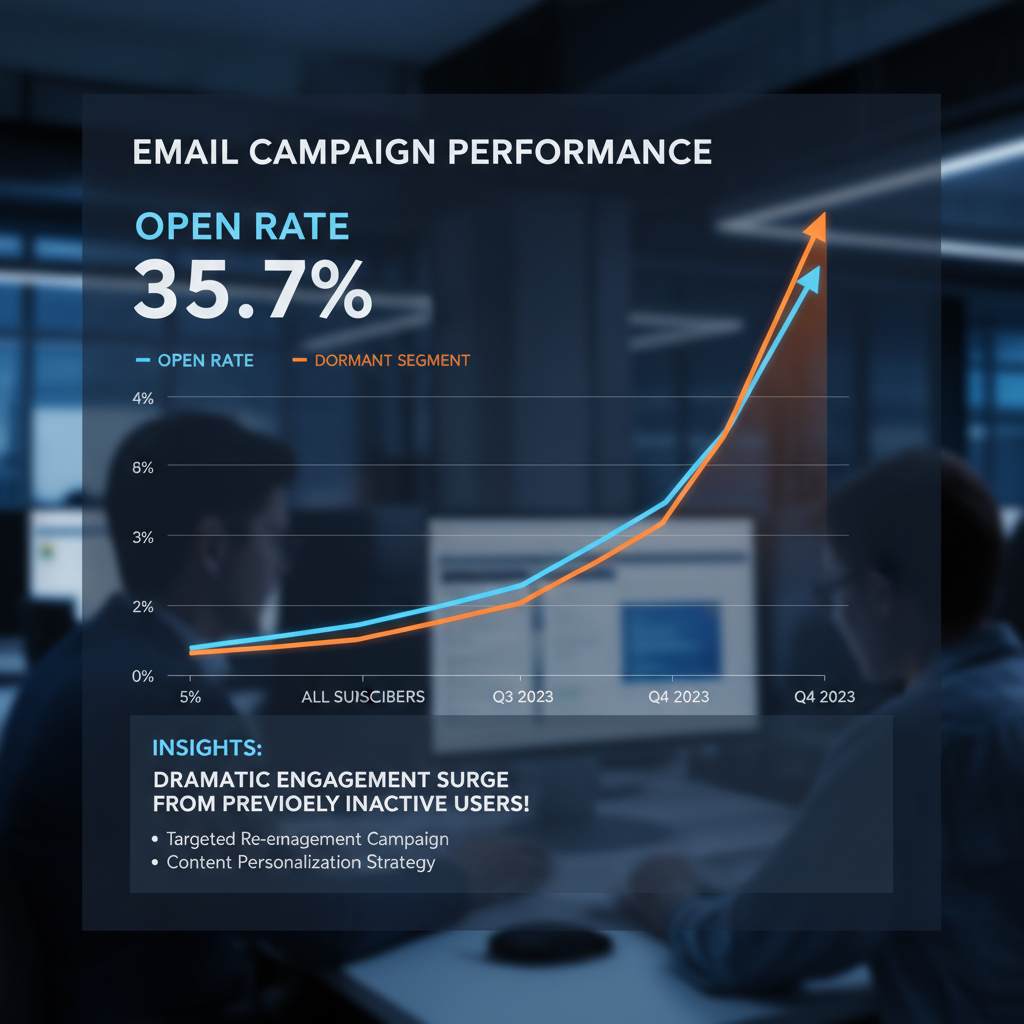
3.1×
Pipeline from email reactivation
A 90-day-dormant segment that every analyst had written off generated more qualified pipeline in three weeks than the entire Q3 paid acquisition budget.
The send was plain text. No images, no logos, no UTM parameters in the visible copy. One question in the subject line. The deliverability alone made the experiment worth documenting.
Two experiments in. Convinced?
One issue. Once a month. Unsubscribe in one click.
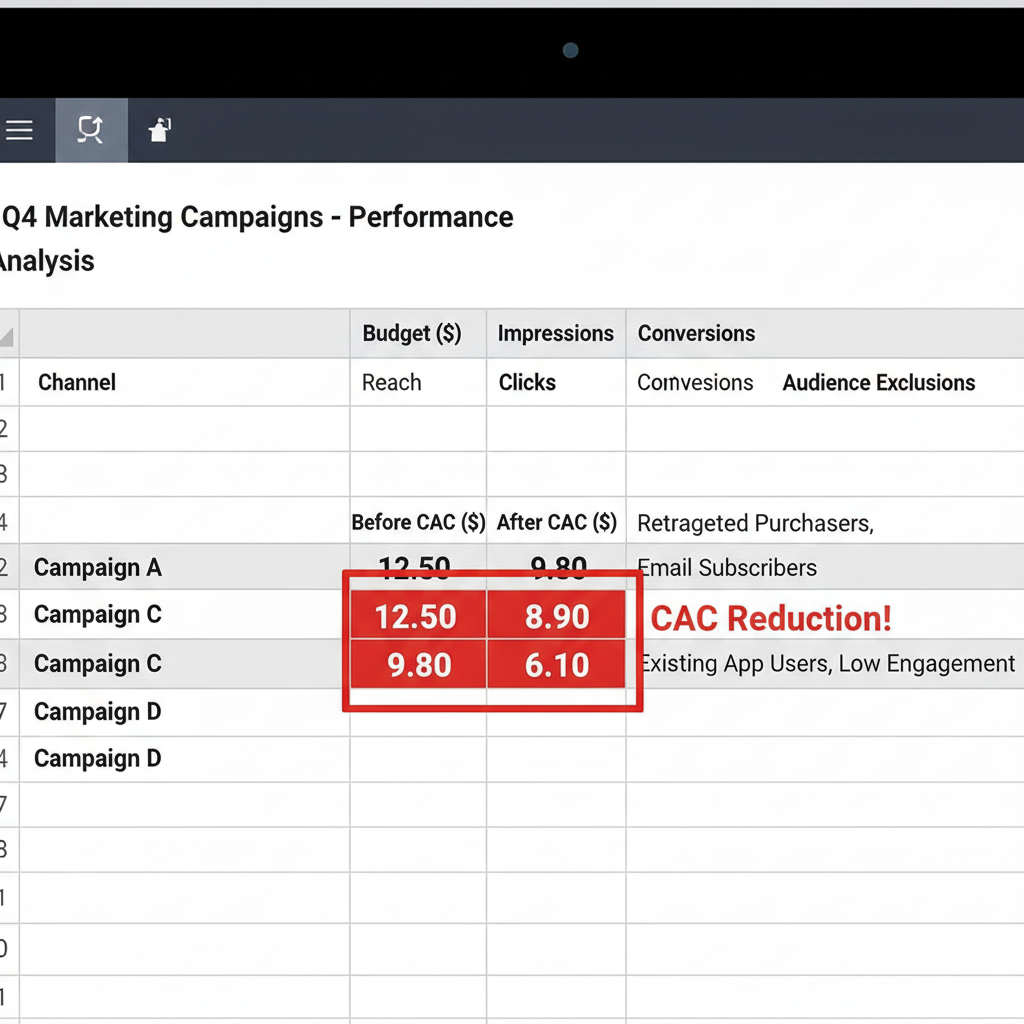
−31%
CAC after audience exclusion fix
The lever wasn't bid strategy, creative, or channel mix. It was a single audience exclusion that had been misconfigured since campaign launch.
Existing customers were seeing prospecting ads. The overlap was 18% of impressions. Removing it dropped CAC by 31% in 72 hours without touching a single creative or budget line.
"The November issue saved us from shipping a campaign that would have torched our list. The funnel autopsy alone was worth six months of agency fees."

Priya Nair
Head of Growth, Threadwell
How One B2B Team Halved Their CAC in 42 Days
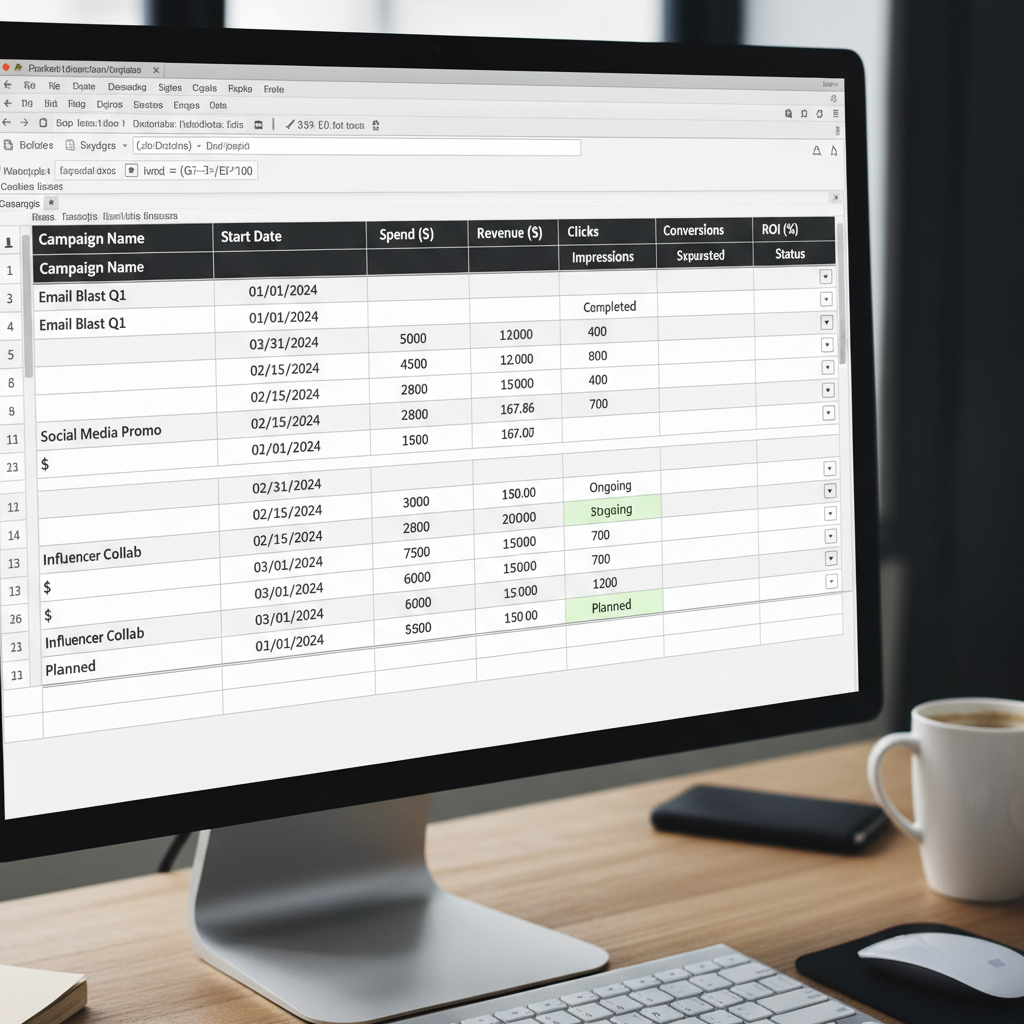
Hypothesis
Cutting CPMs by 40% on branded search and reallocating to mid-funnel video would lower blended CAC without sacrificing pipeline volume.
The Spend
$14,200 over 6 weeks across Google, Meta, and LinkedIn. Every dollar tracked to a UTM. Every UTM tied to a closed deal.
Week 3 Pivot
LinkedIn drove 3× the SQLs at 2× the cost. We killed Meta entirely. The spreadsheet said hold. The data said run.
The Real Lever
Audience exclusions — not bid strategy — were the variable. Removing existing customers from prospecting pools dropped CAC by 31% overnight.
The full issue includes the annotated spreadsheet, the exact audience exclusion logic, and a framework you can deploy in your next campaign brief.
Get the Full IssueMonthly Dispatch
Send Me the Next
Deep Dive.
One growth experiment, dissected in full. The hypothesis, the spend, the week-three pivot, the spreadsheet. Every month.
One issue. Once a month. Unsubscribe in one click.